RRP0002 Series | Version 2.0 Supplement
Cernunnos Foundation | Bright Meadow Group
April 2026
This document addresses technical, financial, and operational questions received from readers of the RRP document series. Where answers are definitive, they are stated as such. Where answers depend on pilot data not yet collected, that is stated plainly. The RRP is an open-access project. Honest questions deserve honest answers.
robert@brightmeadowgroup.com | www.cernunnosfoundation.com
1. Evaporation Greenhouse — Mechanism and Specification
Q: The evaporation greenhouse is described as a critical link between biofiltration and the greenhouse complex, but the document provides almost no specification for how it actually works. What is the mass balance through this zone? How much concentration does it achieve, at what energy cost, and what happens to trace contaminants during evaporation?
The evaporation greenhouse is the least specified component in the current design, and we know that. The concept operates on the same principle as reverse osmosis — but uses solar energy and open-air evaporation instead of a pressurized membrane to separate water from dissolved solids. Nutrient-laden water from the biofiltration train flows into shallow, wide-surface-area beds inside the greenhouse envelope. Solar heat trapped by the structure accelerates evaporation, leaving behind a denser slurry with higher concentrations of nitrogen, phosphorus, and dissolved organics. This concentrated feedwater enters the crop greenhouse complex, improving biological uptake efficiency. No energy input beyond the greenhouse structure is required.
Clean water recovery occurs through condensation capture netting — the same class of technology used in fog-collection projects in arid regions worldwide, where fine polypropylene or stainless mesh nets intercept airborne moisture and channel it by gravity into collection troughs. In the RRP configuration, these nets are positioned on cooler interior surfaces (roof panels and end walls) where rising warm vapor condenses and is channeled to a clean-water header. This recovered water has been physically separated from dissolved nutrients by the evaporation process itself. No chemical treatment is required.
Variable C in the financial model confirms: the evaporation house produces zero biomass output (RRP4, Section 4.3; RRP6, Variable Table). It performs phase separation only.
The evaporation greenhouse is not a single point of failure. If it underperforms or fails to achieve adequate concentration, the system does not collapse. The fallback is additional biological media surface area or an additional grow-bed greenhouse inserted into the process flow. The system architecture is modular precisely so that underperforming zones can be reinforced without redesigning the whole node.
The mass balance, condensate quality, concentration factor, and trace contaminant behavior through this zone will be among the first measurements the pilot generates. Both underlying technologies — greenhouse solar evaporation and fog-net condensation — are independently well-established and commercially practiced. The novel element is their integration into a nutrient-recovery production cycle at this scale. This is explicitly a research application. We are not going to fabricate numbers for a component we have not built.
Cross-reference: RRP4 (RRP0002.5) Section 4; RRP1 (RRP0002.2) Section 4; RRP8 (RRP0002.9) pilot measurement protocols.
2. Water Balance — The 55% Clean-Water Return Figure
Q: The document states that approximately 55% of intake water is returned to the river as clean outflow, with the remainder locked into biomass or lost to evapotranspiration. That’s a significant water consumption claim. Where does this number come from, and what are the implications for water rights at scale?
The 55% figure is a modeled estimate based on existing aquaponic and greenhouse evapotranspiration data, not a measured value from RRP operations. It is, in practical terms, a conservative placeholder. We expect actual water return rates to be significantly higher once the system is built and optimized.
The evaporation greenhouse is specifically designed to recapture clean evaporated water through condensation recovery. Vapor netting deployed throughout the greenhouse complex adds further capture surface. These recovery systems exist to minimize water loss — the design intent is to return as much clean water as possible, not to consume it. Additionally, the operators who build and run these systems — greenhouse operators, aquaponic engineers, water treatment professionals — tend to over-engineer water recovery on site. We expect field-discovered best practices to make our current estimates look conservative.
The water rights question is legitimate and site-specific. Any node drawing from a regulated waterway will need to address consumptive use in its permitting. The system is designed as a net water benefit — cleaning and returning the majority of what it takes — but the exact return ratio will vary by site, climate, crop mix, and season. This is a parameter the pilot will measure directly.
Cross-reference: RRP0 (RRP0002.1) Executive Summary; RRP4 (RRP0002.5) Section 4.2.
3. Thermal Self-Sufficiency
Q: The HTC/HTL section states that the system is “thermally self-sustaining under normal operating conditions” and calls this “a confirmed design characteristic, not a projection.” How can a design characteristic be confirmed for a system that has never been built?
The phrasing in the current document is too strong and will be revised in a future update. “Confirmed design characteristic” should read “design target supported by thermodynamic modeling and site-dependent climate conditions.” This correction has not yet propagated to RRP5 (RRP0002.6), which still carries the original language as of Version 2.0. It will be corrected in the next revision.
The practical reality is more straightforward than the language debate suggests. For southern deployment sites — and the entire first-wave target corridor runs from Memphis to New Orleans — thermal self-sufficiency is not an engineering challenge. A gravel thermal mass pit, basic ductwork, and a fan will keep greenhouse temperatures adequate on the coldest winter night south of Memphis. The waste heat from HTC/HTL reactors is supplementary in warm climates, not essential. Variable V in the financial model confirms: no external heating or cooling is purchased. Energy costs are limited to pumps, administrative systems, and processing.
North of that corridor, heating costs may emerge as an operating expense, and the thermal loop from reactor waste heat becomes more important to the energy balance. The thermodynamics of HTC/HTL waste heat recovery are well-established in the literature. But we will not claim the integrated energy balance of a full node is “confirmed” until we have measured it. The pilot will generate the energy balance data, and the financial model will update accordingly.
Cross-reference: RRP5 (RRP0002.6) Section 5; RRP6 (RRP0002.7) Variable V.
4. Nitrogen Credit Markets
Q: The financial model shows that Model A standalone profitability requires nitrogen credits priced at $5.25/lb. But functioning nitrogen credit trading markets don’t exist in most U.S. watersheds, and the Lower Mississippi corridor — your primary deployment target — has no nutrient trading program at all. Isn’t this a fundamental dependency on policy that hasn’t been written?
Yes. The nitrogen credit revenue line is based on market research, emerging policy trends, and the trajectory of nutrient trading programs in jurisdictions like the Chesapeake Bay. We are not experts in environmental credit market development, and we do not claim that this revenue stream is guaranteed.
The three-scenario financial model (RRP6, RRP0002.7) addresses this directly. Under the Stress Test scenario — floor-market prices, no grants, no credit market activity — Model A loses $1.83M EBITDA and Model B loses $1.35M. The system loses money but continues to function, and the environmental mandate is fulfilled regardless. Under the Operating Model, the $5.25/lb nitrogen credit price produces standalone Model A profitability. Under the Best Case, Model A clears $4.14M EBITDA and Model B clears $4.74M. Nitrogen credits account for 83–89% of revenue in the Operating Model and Best Case scenarios.
The system does not require credit markets to function. The biology works regardless of whether anyone pays for the nutrient removal. The hub-and-spoke cluster architecture provides operating revenue independent of credit markets: the minimum viable cluster — one Model A hub plus one Model B satellite — produces +$241k EBITDA (+4.4%) at Operating Model prices. The system requires credit markets to be profitable at scale — not to operate. That distinction matters.
The political and regulatory pressure to create nutrient trading markets is increasing, not decreasing. The Gulf Hypoxia Action Plan, state-level TMDL programs, and federal interest in market-based environmental solutions all point toward functioning nutrient credit markets in major watersheds within the next decade. The RRP is positioned to be a supplier in those markets when they mature.
Cross-reference: RRP6 (RRP0002.7) Sections 1A–1C; RRP12 (RRP0002.13) Section 2; RRP9 (RRP0002.10) Section 6.
5. HTC/HTL Reactor Sizing and Feedstock
Q: The document describes a hub-and-spoke cluster where one Model A hub serves 5–10 Model B satellites, but acknowledges that the correct cluster size depends on biomass yield data that doesn’t exist yet. How confident are you in the reactor economics if the actual feedstock mix doesn’t match the assumed HTC/HTL split?
We are confident in the science — HTC and HTL are proven thermochemical processes with well-documented conversion parameters. Version 2.0 documents the operating conditions at smallest commercial scale: HTC operates at 180–220°C, 2–6 MPa, with 2–6 hour residence times; HTL operates at 280–370°C, 10–25 MPa, with 15–60 minute residence times. These parameters are drawn from published data from TerraCarbon, AVA-CO2, Pacific Northwest National Laboratory, and Aarhus University/Steeper Energy demonstrations.
We are not confident in the specific cluster sizing because that number depends entirely on how much biomass a single grow unit produces per unit time, and that number does not exist yet. The range of 5–10 satellites per hub reflects that uncertainty honestly. The feedstock split between HTC and HTL pathways — currently modeled as 80% of algae biomass to HTL and 60% of fiber/structural biomass to HTC — is a modeling assumption flagged ♠ that will be calibrated by pilot data. If the actual crop mix produces a different ratio, reactor utilization and product economics will shift. That is expected and planned for.
The practical backstop is that the reactor does not depend solely on greenhouse biomass. Every community generates sewage. Every agricultural operation generates organic waste. The reactor can accept municipal biosolids as supplementary feedstock, and cartage of organic material to the HTC grinder is always available as a fallback input. Billions of tons of organic material that could be converted into hydrochar and bio-oil are currently landfilled, lagoon-stored, or discharged into waterways every year. The RRP reactor is one way to capture that value.
Cross-reference: RRP5 (RRP0002.6) Sections 3–5; RRP6 (RRP0002.7) Variable I.
6. Crop Selection — Candidates vs. Confirmed Species
Q: The greenhouse section lists hemp, jute, flax, willow coppice, bamboo, miscanthus, nettles, duckweed, and various algae species as the planned crop architecture. Has anyone actually grown these species hydroponically on variable-chemistry river water? This reads more like a literature review than a planting plan.
It is both, and that is intentional. These are the crops that have market value and that we have assessed as ideal candidates based on their nutrient uptake profiles, biomass yield potential, harvest cadence, and downstream market applications. They are the starting roster for the pilot, not a locked specification.
The question of whether these specific species perform in hydroponic culture on variable-chemistry river water with fluctuating nutrient concentrations is exactly the question the pilot is designed to answer. That is the point. Academic literature provides yield and uptake data for individual species under controlled conditions with stable nutrient inputs. It does not provide integrated system performance data for a 13-house rotating crop complex operating on real river water. No one has that data because no one has built this system.
What we can say from direct experience is that aquaponics is remarkably forgiving as a growing method. There is virtually nothing that cannot be advantaged by aquaponic culture, even if you are simply using the nutrient-rich water to irrigate potted root systems. The specific species listed were selected because they combine high nutrient uptake with viable market pathways — not because they are the only species that would work.
The crop architecture is designed to be modular for exactly this reason. Greenhouses are physically isolated subunits with independent climate control and hydraulic connections, fed by a PLC-controlled nutrient routing grid that matches nutrient chemistry to crop demand curves (RRP4, Section 5). If a species underperforms, it is replaced in its house without disrupting the others. The system does not depend on any single crop succeeding — it depends on the aggregate uptake across all houses meeting nutrient removal targets.
Cross-reference: RRP4 (RRP0002.5) Sections 1–3; RRP8 (RRP0002.9) Axis 3; RRP6 (RRP0002.7) Variable E.
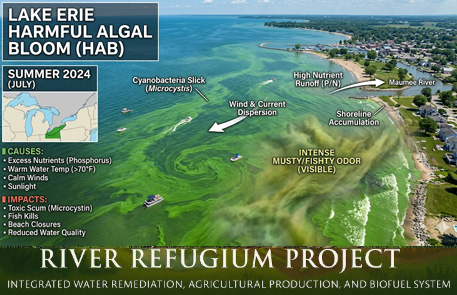
7. End-of-Mission Economics — What Happens When the River Gets Clean?
Q: The document makes an elegant argument that the system becomes less profitable as the river gets cleaner, and calls this “the correct outcome.” But a 100-acre node with millions in equity doesn’t gracefully decommission. What does the end of mission actually look like?
The framing in the document is aspirational. The practical reality is that this market has no foreseeable end. Human activity generates nutrient pollution continuously — agriculture, sewage, stormwater, industrial discharge. As long as people farm, flush, and build, rivers will carry nutrient loads. The idea that an RRP node would run out of feedstock assumes a level of upstream remediation that does not exist and is not projected to exist within any planning horizon.
Even in a best-case scenario where upstream practices dramatically reduce nutrient loading, the timeline for that reduction is measured in decades. Legacy phosphorus alone — phosphorus already bound in agricultural soils from decades of over-application — will continue leaching into waterways for generations. The nutrient problem is not a spill that gets cleaned up. It is a structural consequence of modern land use.
If a node’s watershed does approach nutrient depletion — which would be an extraordinary success — the infrastructure has conversion pathways. Greenhouses can transition to conventional controlled-environment agriculture. Biofiltration infrastructure has value for municipal water treatment. The reactor serves any organic waste stream, not just RRP-produced biomass. The land itself retains value. But we are not spending planning cycles on sunset scenarios. The global trend in nutrient pollution is upward, not downward.
Cross-reference: RRP10 (RRP0002J) Strategic Deployment Outlook; RRP12 (RRP0002.13) Section 4.
8. Heavy Metals and Emerging Contaminants
Q: The Operator Brief notes that the system is optimized for organic load, not heavy metals. But river water — especially lower Mississippi water — carries cadmium, lead, mercury, arsenic, and potentially PFAS alongside the nutrients. These accumulate in biomass. Where do they end up after thermochemical processing — in the hydrochar, the bio-oil, or the aqueous phase that recirculates to the algae houses?
This is an area where we have informed expectations but not yet adequate knowledge to make definitive claims. Full disclosure: the crop selection hints at our hopes in the heavy metal area. Several of the candidate species — particularly certain algae, duckweed, and hemp — are known hyperaccumulators or bioconcentrators of heavy metals in the phytoremediation literature. Their selection was not accidental.
The potential pathway is that heavy metals accumulate in biomass during the growing phase, are concentrated through harvest, and are then partitioned during thermochemical processing. In HTC, heavy metals tend to concentrate in the solid hydrochar fraction rather than the aqueous phase — which is favorable, because it means they can be captured and sequestered in a stable solid rather than recirculated through the system. The literature on heavy metal fate during hydrothermal processing is growing but not yet definitive for the specific feedstock mixes the RRP would produce.
What we will not do is make claims we cannot support. The heavy metal and emerging contaminant question will be addressed through pilot testing — specifically, by analyzing biomass tissue, hydrochar, bio-oil, and aqueous phase for metals and contaminants of concern at each stage of the process. If the system demonstrates meaningful heavy metal removal and safe sequestration, that becomes an additional value proposition. If it does not, the system is still designed for nutrient remediation, and heavy metal management remains a separate infrastructure problem.
The PFAS question is even less settled. PFAS behavior during hydrothermal processing is an active area of research with limited published data. We are watching that literature closely but are not making any claims about PFAS destruction or capture until the science supports it. This is an honest gap in the current documentation, and we intend to address it more thoroughly as pilot data and the published literature advance.
Cross-reference: RRP4 (RRP0002.5) crop species rationale; RRP5 (RRP0002.6) phase separation; RRP8 (RRP0002.9) Axis 4 measurement protocols.
9. Regulatory Permitting — Is This Really as Simple as the Document Suggests?
Q: The governance document positions the RRP as favorably situated under Clean Water Act frameworks because it removes pollutants rather than discharging them. But the system does discharge water back to the river. Won’t that require an NPDES permit, and doesn’t that complicate the “net reducer” framing?
The system does return water to the river, and that return will require regulatory review. Any point-source return to a navigable waterway falls under NPDES jurisdiction, and we expect to obtain discharge permits for every operating node.
The favorable positioning — as described in RRP7 (RRP0002.8) — is that the system places the RRP in a favorable regulatory category relative to NPDES permitting, 303(d) impaired water listings, TMDL frameworks, state revolving funds, and watershed nutrient caps. The discharge is demonstrably cleaner than the intake. The permitting conversation is fundamentally different when you are provably improving water quality rather than introducing new pollutants. Regulators still need to review the discharge, but the regulatory posture is cooperative rather than adversarial.
Site-specific permitting complexity will vary. Intake protections, construction in floodplains, wetland adjacency, endangered species considerations, and state-level water quality standards all introduce variables that the document series addresses at the framework level but that will require site-specific engineering and legal work for every deployment. The polishing house (RRP4, Section 3) provides the documented proof of final nutrient removal before discharge — the delta between polishing house inlet and outlet is the performance receipt that feeds directly into N/P credit calculation and environmental compliance.
We do not claim that permitting is simple. We claim that the system’s environmental profile makes permitting achievable, and that the regulatory alignment across EPA, USDA, and DOE creates a political environment where three federal agencies believe the project falls within their mandate. That is a structural advantage.
Cross-reference: RRP7 (RRP0002.8) Sections 1–3; RRP4 (RRP0002.5) polishing house verification.
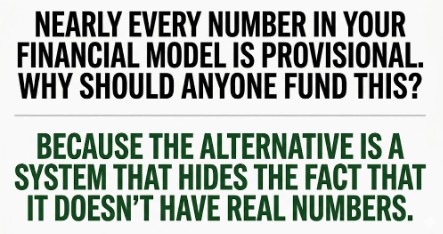
10. Why Should Anyone Trust Projections Built on Provisional Data?
Q: Nearly every quantitative claim in the financial model is flagged as provisional. The yield data is academic. The market prices are projected. The credit markets don’t exist yet. Why should a funder commit capital to a system that openly admits it doesn’t have real numbers?
Because the alternative is a system that hides the fact that it doesn’t have real numbers.
Every novel infrastructure system begins with modeled projections. The question is whether the projections are honest about their sources, whether the model is structured to update when real data replaces estimates, and whether there is a credible mechanism to generate that real data.
The RRP financial model is built on slot assumptions rather than crop assumptions. Every provisional figure is flagged with ⚑ markers and traceable to specific peer-reviewed sources (RRP6, Section 1A cross-reference table). The model contains 43 named variables across 9 sheets, each linked to a source document in the technical series. When measured values replace estimates, the model recalculates automatically. The structure does not change. The inputs do.
A funder is not being asked to trust projections. A funder is being asked to fund the measurement instrument that replaces projections with data. The pilot — one full grow unit — generates biomass yield curves, seasonal variation data, nutrient uptake rates, and maintenance cycle impacts that narrow the uncertainty range every month it operates. RRP8 (RRP0002.9) governs all measurement standards, and Axis 3 data collection is the direct replacement mechanism for provisional financial model assumptions.
The open-data commitment reinforces this. Every data point the pilot generates is published. No selective disclosure, no proprietary black boxes, no numbers that only the project team can see. A funder who commits capital to the pilot receives the same dataset that regulators, academics, and the public receive. That transparency is the trust mechanism.
Cross-reference: RRP6 (RRP0002.7) Variable Table; RRP8 (RRP0002.9) Sections 3–4.
11. Who Has Reviewed This Technically?
Q: The document series references internal Bright Meadow Group and Cernunnos Foundation sources extensively. Has any independent engineer, academic institution, or regulatory body reviewed the technical claims?
The RRP document series is published as an open-access framework specifically to invite that review. The documents are available at no cost, with no registration, and with no restrictions on academic or institutional use. Every recognized learning institution has full free access from K–12 through doctoral programs. All proprietary IP claims have been removed as of Version 2.0.
Independent technical review is welcomed and actively sought. The Field Documentation Kit — published alongside the v2.0 series — exists specifically to enable independent operators to test the core biological thesis using their own systems, their own water, and their own measurement protocols. The Kit provides standardized forms (System Configuration Record, Periodic Data Log, and Observation and Notes Log) that allow field data from any scale of operation to be aggregated and compared. Aggregated field data from independent operators will either validate or challenge the framework’s assumptions — and both outcomes advance the project.
We are a small organization publishing a large idea. Formal peer review, institutional partnerships, and regulatory pre-consultation are objectives, not accomplishments. The documents are public because the fastest path to credible review is making the work available to everyone who might review it.
Cross-reference: RRP Master Document Index (RRP0002); Field Documentation Kit; RRP8 (RRP0002.9) Section 4.
12. Can This Really Be Built by a Small Organization?
Q: The RRP describes a 100-acre industrial node with HTC/HTL reactors, SCADA/PLC automation, 13 greenhouses, and a six-tank biofiltration train. This sounds like a major infrastructure project. Can a foundation and a consulting group actually build this?
A foundation and a consulting group can design it, document it, and publish it. Building it requires partners, capital, and a site. That is the current phase of the project — finding the right combination of funding, institutional partnership, and deployment site to build the pilot.
The document series is the engineering framework. The pilot is the proof instrument. The deployment requires the kind of institutional, municipal, tribal, or private partnership described in RRP7 (RRP0002.8). We are not claiming to build this alone. We are claiming to have designed a system worth building, and we are publishing the design openly so that the right partners can find it.
The capital stack (RRP7, Section 4) is deliberately diversified to draw from multiple funding sources simultaneously: USDA Rural Development grants and loans, EPA 319(h) watershed funding, DOE bioenergy pilot grants, state infrastructure incentives, tribal funding channels, municipal and utility partnerships, private capital seeking ESG returns, and carbon and nutrient credit revenue streams. No single funding source carries the project. The environmental mandate and the revenue model reinforce each other.
The documents are doing the work of finding the right partners. Someone in that readership has the resources, the mandate, or the river.
Cross-reference: RRP7 (RRP0002.8) Sections 4–5; RRP11 (RRP0002.12) Section 3.
Questions, data submissions, and partnership inquiries:
robert@brightmeadowgroup.com | www.cernunnosfoundation.com/rrp
Full RRP documentation series available at no cost:
www.cernunnosfoundation.com/rrp
Cernunnos Foundation / Bright Meadow Group | RRP Document Series RRP0002 | Version 2.0 | April 2026